

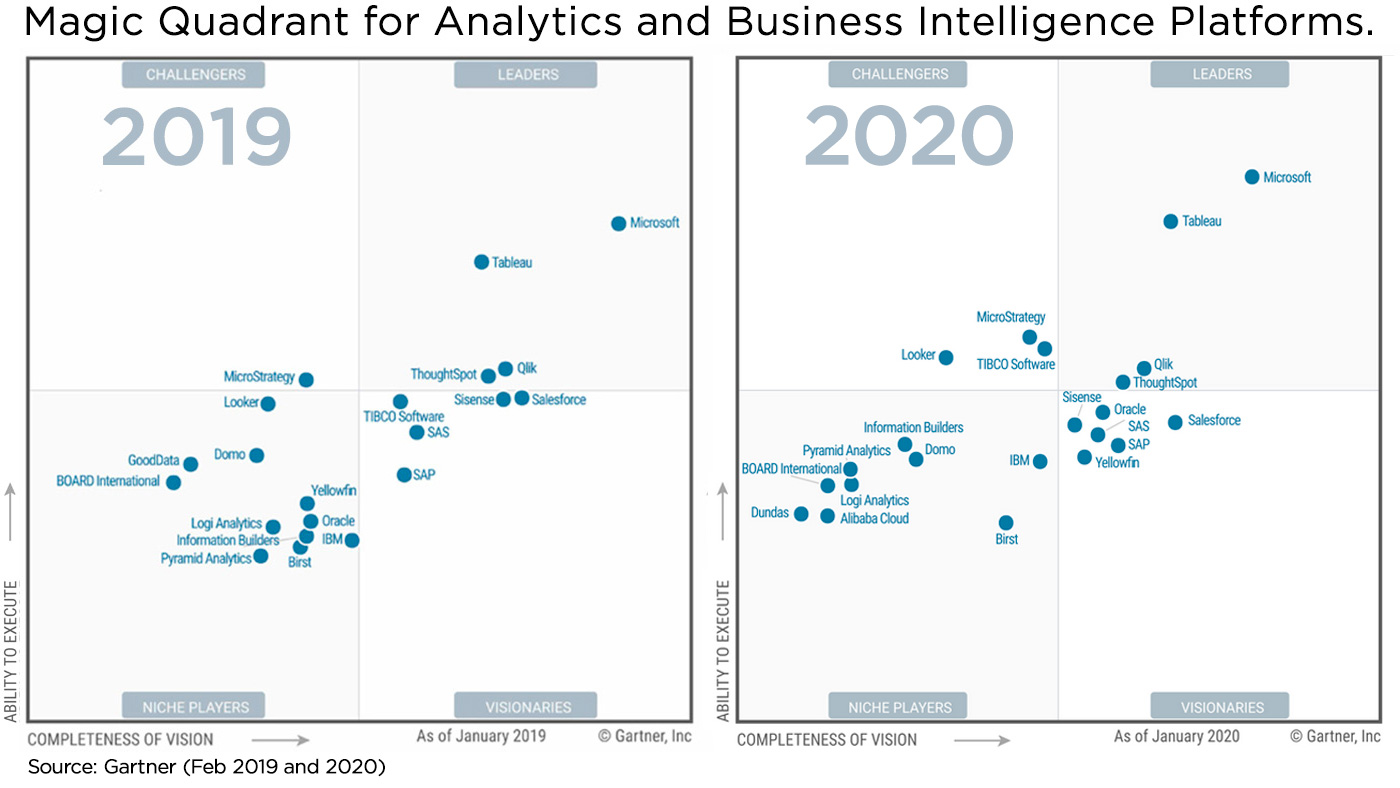
Qlik in the leading quadrant for the 10th year in a row
The 2020 Gartner Magic Quadrant for Analytics and Business Intelligence Platforms is here. In the Leaders Quadrant this year, we see four players, Qlik among them. Read the report and get an impartial view of the BI landscape. For you who are unfamiliar with the Gartner Magic Quadrant, this is how it works. | The Gartner Report for 2021.
Don’t just look at the picture, read the report. Download the Gartner MQ report to get an overview of the analytics market and find:
- A uniform set of evaluation criteria ― making it easier to compare BI tools.
- A neutral analysis of how each vendor aligns to completeness of vision and ability to execute.
- A quick visual take of the BI landscape ― instantly showing who has been recognized.

Discover all the ways that Qlik gives you the power to accelerate business value through data:
![]()
Explore without boundaries
Use our unique Associative Engine to freely explore all your data, regardless of skill level ― and discover hidden insights that query-based tools would miss.
![]()
Amplify your instincts with augmented intelligence
Take advantage of Qlik’s powerful AI and machine learning to accelerate discoveries, boost data literacy, and surface contextual — so your whole team can move your business ahead.
![]()
Start fast in the cloud ― deploy anywhere
Get started immediately in the cloud with our full-featured free trial. Use our flexible deployment capabilities for seamless end-user experiences and management capabilities across multi-cloud environments.
![]()
Take analytics to the point of decision
Bring the power of insights to everyone by embedding analytics right into your processes and workflows, thanks to our expansive platform capabilities.
Master the complete data lifecycle
With the Qlik Data Integration Platform, you can do it all without data lock-in: powerful data integration and movement, governed cataloguing, and leading modern analytics.
Get everyone speaking data
We’re also leaders in data literacy. Educate and up-skill your team’s data capabilities.

FIND OUT FOR YOURSELF WHAT MAKES QLIK A LEADER!
QLIK ANALYTICS TOUR INTERNATIONAL WITH CLIMBER
Qlik Analytics Tour International with Climber – Predict your way to Action. Join us for an online masterclass on how to accelerate actions through Augmented Data Analytics at the Qlik Analytics Tour 2020 on September 17th, 10 am CET! The event is free, and spots are limited.
Any questions? Contact us!
Erica Lenksjö
Marketing Director
erica.lenksjo@climber.eu
+46 72 352 35 09
Samantha Hartley
Marketing & Content Specialist
samantha.hartley@climber.se
+46 70 746 75 34
News archive

What is Microsoft Power Apps?
Microsoft Power Apps is a low-code platform that enables businesses to swiftly develop custom applications tailored to their unique needs, without requiring extensive coding knowledge. In this blog you will learn more about the components, use cases, and benefits for your business.
>> Read more
What’s New in Qlik Cloud – Apr 2025
Qlik continues to roll out a comprehensive set of updates across the platform – from workflow automation, machine learning improvements, charting enhancements, new scripting tools, and expanded global coverage.
>> Read more
Optimising Workforce Management for Virgin Wines through custom Microsoft Power Apps
Read how we transformed operations for Virgin Wines, significantly improving their ability to forecast and allocate resources effectively.
>> Read more!