

How long have you wished for customisable tables in Qlik Sense?
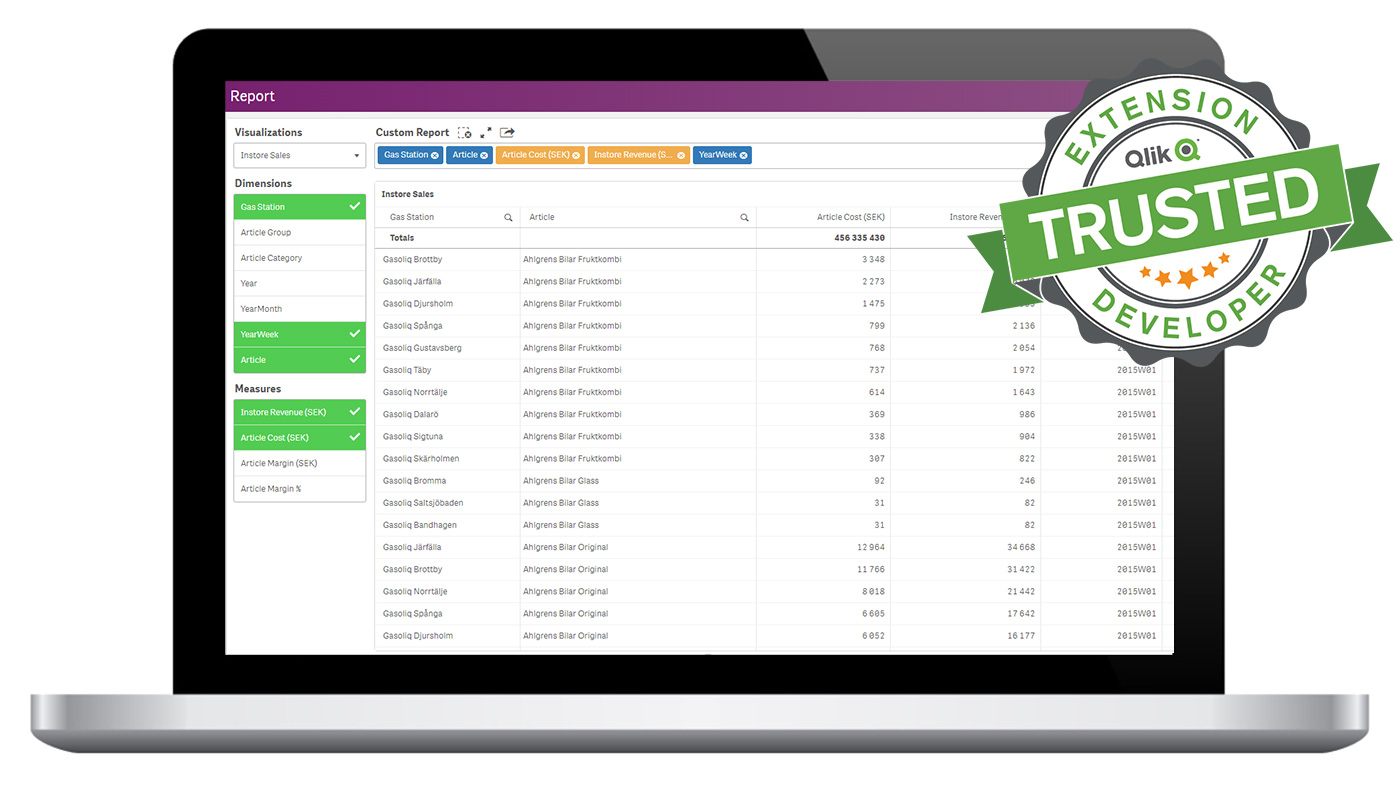
The TED accredited Climber Custom Report Extension for Qlik Sense is the quintessence of self-service, being able to create customised tables based on data in master tables gives you an extremely versatile and powerful tool. With the option to choose any dimension or measure you want to see and visualise in a variety of ways you will always have it your way. Check out the tutorial below!
WITH THE CLIMBER CUSTOM REPORT YOU CAN:
- Visualise your data as a straight table, pivot table or combo chart.
- Sort your data in pivot tables and combo charts.
- Choose between different combo chart options. You can both change layouts and add values.
- Export to an app! Export your customised table. Just select the data, click “export to app” and continue working with your new data set.


GRAB YOUR FREE SPOT AT THE QLIK ANALYTICS TOUR
ONLINE EVENT: Learn how to shorten time from data to action with extensions
Join us for an online masterclass on how to accelerate actions through Augmented Data Analytics at the Qlik Analytics Tour 2020 on September 17th, 10 am CET!
Our friends at Vizlib will showcase how any user can leverage advanced analytics on the fly to predict the best action to follow up, with the help of smart visualisations, clustering and collaboration in Qlik Sense. The event is free, and spots are limited.
This is how it works.
Check out the tutorial!
NEW FEATURES
- Defer Layout Update – Wait for confirmation before updating the visualisation.
- Show details – Use descriptions in your master item dimensions and measures.
- Icons – Option to use icons instead of a drop-down menu.
- Hide-options – Hide items on the context.
- Combo Chart options – Show/Hide data labels and data points.
- Sort dimensions/measures – Now available in pivot tables and combo charts too.
CHANGES AND BUG FIXES
- Totals is on as default if not otherwise specified.
- Reorganised the settings in the property panel.
- Perfect scrollbar bug.
- Export to app.
- Selection errors on large data sets.
- Column order sync error.
- Improved Firefox compatibility.

What are Climber Extensions?
With Climber Extensions, you will get a complete business solution in Qlik Sense. We have developed a series of extensions for more flexible, user-friendly and transparent solutions in Qlik Sense. We have also developed extensions especially for people in the finance department, such as the finance report, custom report, and KPI extensions. Are you using QlikView today? Extensions are the way to an even better BI solution while still retaining some of the old QlikView functionality.
AVAILABLE BY SUBSCRIPTION
Climber Extensions are available by monthly subscription and fees are based on the number of user licenses in Qlik Sense. The extensions can be used on all applications and by all users. The subscription includes installation, normal product support, updates and any additions we make to the packages over time.

Want to know more?
Contact us!
James Sharp
Managing Director
james.sharp@climberbi.co.uk
+44 203 858 0668
Alex Booth
Business Development Manager
alex.booth@climberbi.co.uk
+44 203 858 0668
News archive

The Data Literacy Imperative – Why your business can’t afford to ignore it
A recent Gartner report ranks poor data literacy among the top five barriers to the success of data and analytics initiatives. Discover strategies to bridge the data literacy gap and empower your team to make informed, data-driven decisions.
>> Read more
Microsoft Power Platform vs. Microsoft Fabric: Choosing the right tool for your business
This guide will help you understand the key differences and use cases for Microsoft Power Platform and Microsoft Fabric, while deciding which solution meets your needs.
>> Read more
Qlik a Leader in the 2025 Gartner Magic Quadrant for Augmented Data Quality Solutions
Gartner has published the 2025 Magic Quadrant for Augmented Data Quality Solutions. After evaluating 12 top vendors, they have once again named Qlik a Leader—marking the sixth time!
>> Download the report