

Microsoft Power BI FAQ
Welcome to Climber’s FAQ page for Microsoft Power BI! Here we have collected the most common questions we receive about the BI tools Power Platform and Power BI. We cover topics such as functionality, pricing, and integration between the tools. Whether you are new to the tools or an experienced user, we hope this FAQ can help you gain a better understanding of their roles and how they can help you analyse and visualise your data effectively, so that you can more easily make better decisions.
1. What is Microsoft Power BI, and how can it benefit my business?
Power BI is a business analytics service by Microsoft that provides interactive visualisations and business intelligence capabilities, with an interface simple enough for end users to create their own reports and dashboards. All the most successful businesses today are data-led organisations where decisions are taken using data to give insights and Power BI is designed for exactly that. Power BI is also easy to start using, meaning that the reliance on a dedicated data analysis team for reports is greatly reduced, and empowering colleagues to get the answers they need to do their work.
2. Why should I use Power BI?
Power BI allows for the easy development of reports using one of the many built in connectors to connect to almost any data source. The costs of Power BI licenses are low in comparison to some of the other visualisation tools in the marketplace. And Power BI’s tight integration into the rest of the Microsoft universe, from Office to Fabric to Power Platform, gives Power BI great flexibility and features and makes Power BI an excellent choice for small, medium, and large businesses.
3. How do I start using Power BI?
There are many books available about Power BI, as well as hundreds of websites and video channels where you can learn a lot of useful Power BI skills. Many companies, including Climber, offer training courses. There are also online training courses available. Microsoft has a dedicated learn channel where they teach the essential skills required to use Power BI like a pro.
4. What are the components of Power BI?
Power BI consists of the Power BI Desktop App for designing reports, the Power BI Service for hosting reports, and Power BI Mobile (available on Android and iOS) for viewing reports on mobile devices. In some cases, organisations make use of their own Power BI Report Server in place of using the cloud-based Power BI Service.
5. Do I need coding skills to use Power BI effectively?
Power BI is easy to start with and no coding skills are required. But like other tools in the Power Platform, using the advanced features may require a form of coding. For example, Data Analysis Expressions (DAX) and Mashup Query (MQuery) require the writing of formula languages and building custom visuals requires coding.
6. What’s the difference between Power BI Pro and Power BI Premium?
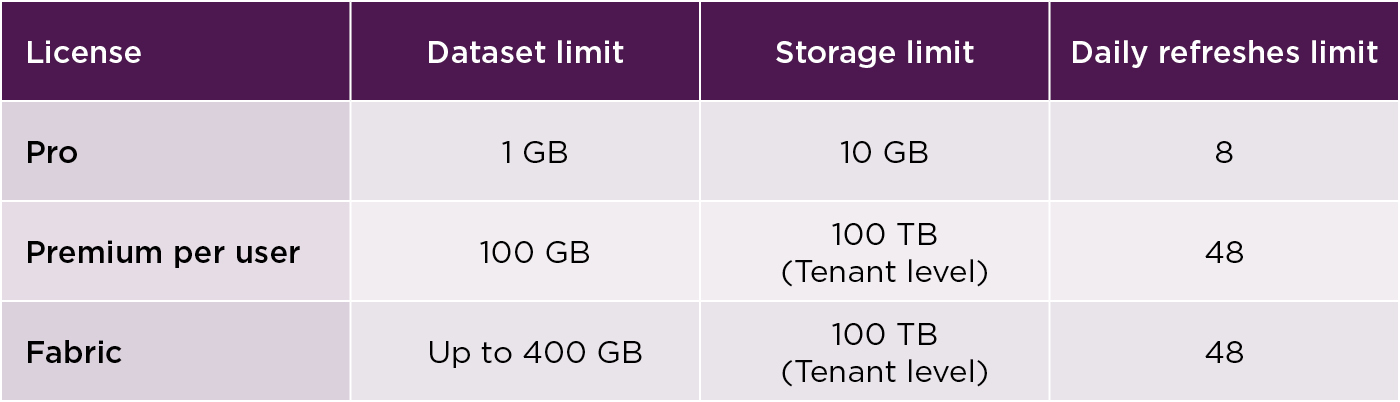
Power BI Pro is intended for smaller businesses with lower data and storage requirements (see table below). Power BI Pro also limits the number of refreshes per day to 8. In contrast, Power BI Premium per user offers 10x more space for datasets and storage and 48 refreshes per day.
7. What licenses are needed for Power BI?
There is no cost for a developer license in Power BI. However, the moment reports need to be shared, a license is required.
Power BI Pro is a per-user license that provides full self-service BI capabilities. Power BI Premium, on the other hand, offers dedicated cloud resources and advanced features for larger-scale deployments, and Fabric licenses include access to a host of data tools including Power BI. For more information on licensing, click here.
8. What software is needed to develop Power BI reports?
Whilst it is technically possible to develop reports via a browser on the Power BI Service, to get the full functionality of Power BI, developers will want to download and install the free Power BI Desktop App (available from the Microsoft Store) to build and modify reports.
9. What data sources can Power BI connect to?
Power BI can connect to over 150 different data sources using the dedicated connectors. Power BI also has a host of generic data connectors (e.g. CSV, ODBC, JSON, XML). This means that Power BI can connect to almost any data source.
10. Can we use Power BI for real-time data analysis?
Power BI allows connecting to data via direct query, where a system can be queried in real time. If data is stored in a Fabric Lakehouse, direct Lake mode also offers real-time data analysis. And finally, even in import mode, with up to 48 queries per day, this means data is at most 30 minutes out of date. For all but the most stringent real-time requirements, this is sufficient.
11. Can I customise the look and feel of my reports in Power BI?
Yes, Power BI offers various customisation options to format and style your reports and dashboards according to your brand. Power BI offers themes which can be customised to your corporate colour and font standards. It is simple to add logos and other branding elements to report pages.
12. How does Power BI integrate with other Microsoft tools?
Power BI has a few features for integration with Office 365. Power BI visuals can be embedded into PowerPoint slides with live connections to show the latest values. Power BI also allows users to analyse semantic models (the data models built for the reports) using Excel, thereby allowing Excel users to interact with the same data as was used to generate the reports. Power BI also has features that integrate with other Microsoft tools such as SharePoint, Dynamics365, and Teams.
13. Does Power BI integrate with Power Apps?
Power BI integrates with Power Apps by embedding apps directly into Power BI reports, enabling users to take action on data insights. Additionally, Power BI tiles can be embedded within Power Apps, allowing users to view interactive reports alongside app functionality for a seamless experience. Alternatively, Power BI can connect directly to data sources such as the Dataverse, or SQL to extract data generated using Power Apps.
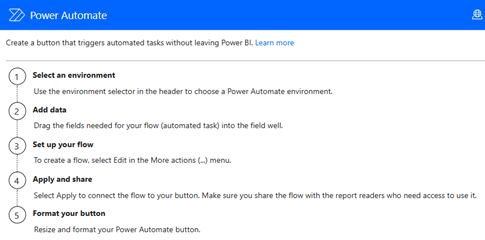
14. Does Power BI integrate with Power Automate?
Power BI reports allow for the embedding of a Power Automate tile directly into the report, allowing for task automation from within a report.
15. How secure is our data when using Power BI?
Power BI has several security features. Authentication through Azure Active Directory restricts reports to authorised users. Row level security allows for segregation of data based on roles or users and data encryption ensures data is kept secure. Furthermore, the automated nature of Power BI reports ensures data integrity by reducing the risk of data manipulation.
16. How can I ensure my team adopts Power BI effectively?
Implement a structured training program and encourage knowledge sharing within your team. We also offer change management strategies for smooth adoption. Ensuring that the required data for reporting is easily accessible and reliable also helps to encourage colleagues to use the features that Power BI offers for quickly building trusted reports.
17. What options are available for debugging and error resolution in Power BI?
Power BI includes tools like Performance Analyzer to help identify performance issues. When writing DAX, Power BI now has a DAX Query View to allow the debugging of code written to generate specific metrics. Power Query also offers an easy-to-use interface where users can step through a process to determine where errors are arising, making debugging straight-forward.
18. Can I collaborate with my team on Power BI reports?
Absolutely! Collaboration is what Power BI is all about. Power BI supports collaboration through shared datasets, workspaces, and the ability to publish reports for team access, making the sharing of reports and working on reports as a team a simple process.
19. What is DAX?
DAX stands for Data Analysis Expressions. This is Power BI’s formula language, used to create custom calculations and aggregations in the data model.
20. What is Power Query?
Power Query is the Extract, Transform, and Load (ETL) tool built into Power BI and Excel. Power Query is a powerful data transformation tool, allowing for the automation of data cleansing, pivoting and various other transformations.
21. How do I optimise Power BI reports?
To ensure Power BI reports render quickly, the following aspects need to be kept in check:
- Ensure the data model is as small as possible by only importing the data required for the report. Aggregate data where possible to reduce the number of records.
- Ensure the data model is correctly set up. In general Power BI works best with data organised in a star schema with single direction links.
- Ensure that measures are written effectively. Use the performance analyser to determine how long specific visuals take to render, and work on the slowest visuals to improve the report performance.
22. Is Power BI better than Excel?
Whilst both Power BI and Excel can be used to build reports, Power BI can handle significantly higher volumes of data than is possible with Excel. Furthermore, Power BI has more advanced data security features than Excel does. Power BI also has many more visualisation options compared to Excel, particularly when considering the 3rd party visual marketplace with hundreds of additional visuals. Excel and Power BI are complimentary rather than rival tools with each fulfilling a different niche.
23. Is Power BI the best data analysis and visualisation tool?
There are several very capable tools that compete with Power BI such as Qlik Sense and Tableau. Each tool has features that make it appealing and deciding which is best will require aligning the business requirements with the capabilities of the tools. That said, what does stand in Power BI’s favour is that it is part of the wider Microsoft Fabric solution – a merging of many data management tools created by Microsoft. Within Fabric, we have data lakehouses, warehouses, dataflows, Python options, and much more. Power BI’s tight integration into Fabric and the familiarity of the interface for anyone using Office 365 is a positive in Power BI’s favour.
Didn’t find the answer to your question? Contact us!
Gareth Wilson
Senior BI Consultant
gareth.wilson@climberbi.co.uk
+44 203 858 0668
Scott Davies
BI Consultant & Training Manager
scott.davies@climberbi.co.uk
+44 203 858 0668