

Microsoft Power BI Service Options & Settings: The Ultimate Guide
Author: Scott Davies, Business Intelligence Consultant at Climber.
Mastering Microsoft Power BI for Data-Driven Success
Microsoft Power BI is a leading business intelligence (BI) platform that empowers users to analyse data, create interactive reports, and make data-driven decisions. Understanding Power BI’s service options and settings is crucial for optimising efficiency, security, and collaboration.
This comprehensive Power BI guide covers essential features, including report management, access controls, sharing options, and advanced settings.
Microsoft Power BI Report Buttons & Access Controls
Power BI offers powerful reporting features that determine how users interact with reports. However, permissions and functionalities depend on user roles, permissions, and licensing.
Examples of User Roles & Permissions in Power BI:
- Viewer Role: Read-only access for viewing reports.
- Admin Role: Full control over permissions, report modifications, and security settings.
- Direct Access vs. Shared Links: Direct access is recommended for security and user control.
This guide covers the options presented above reports when viewing a report in the Power BI Service.
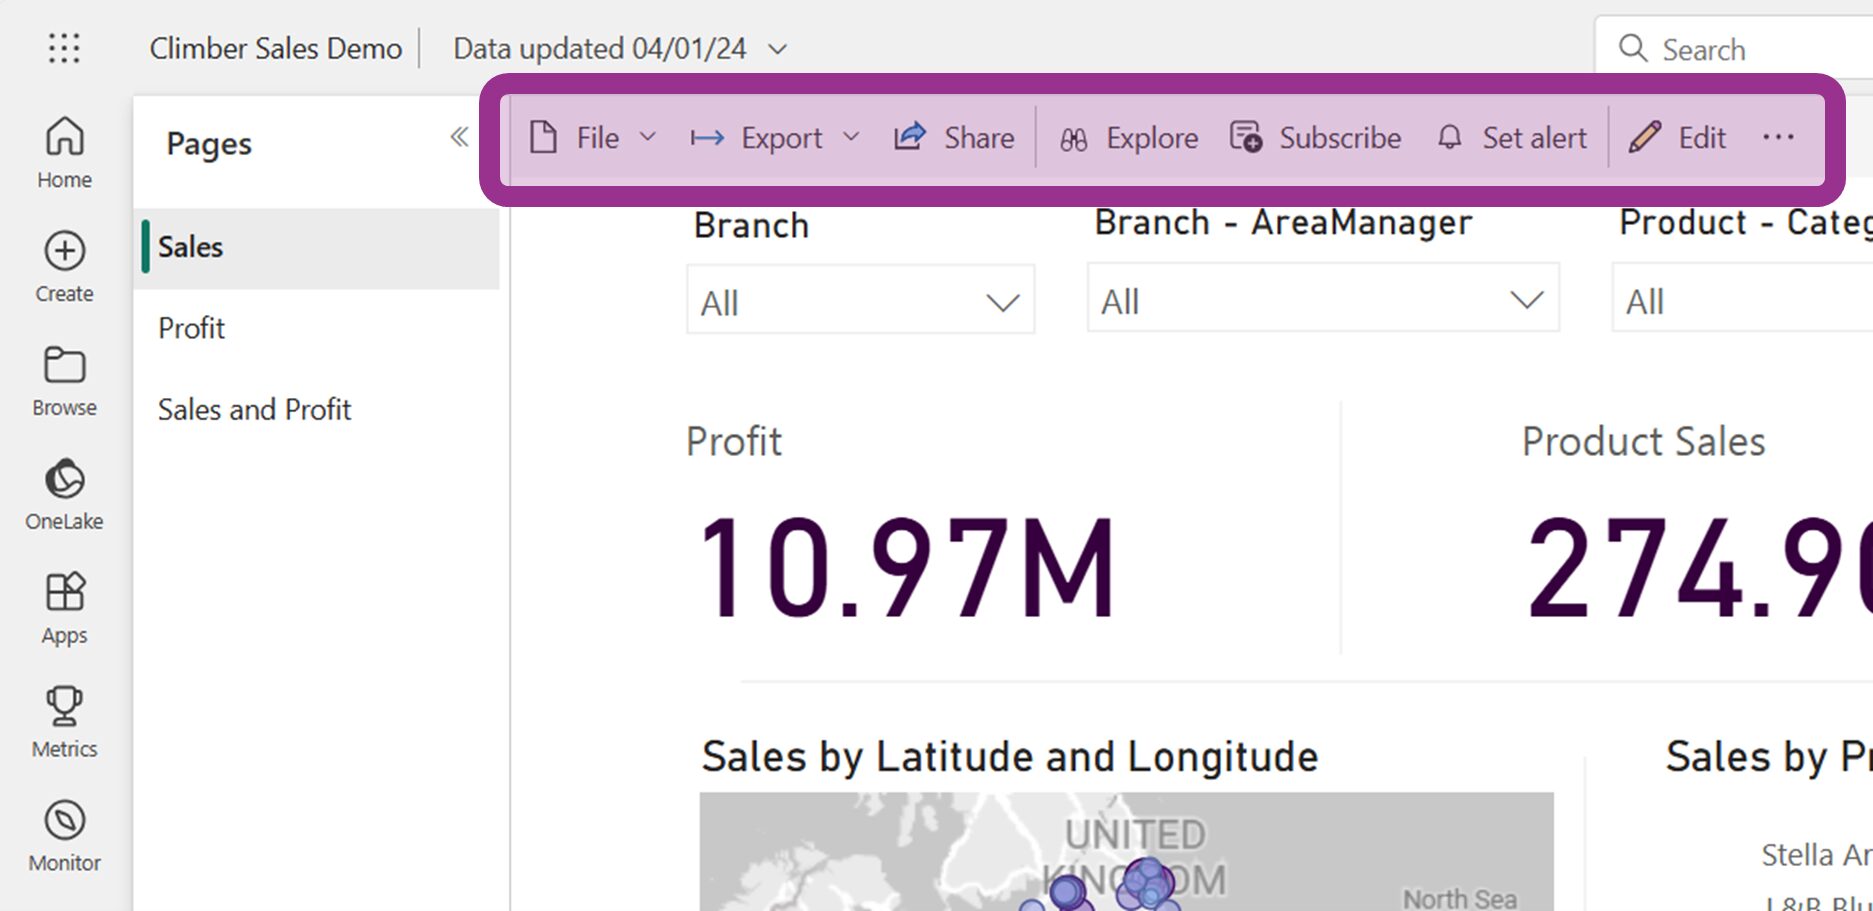
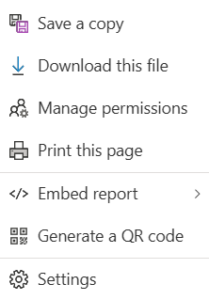
File Menu Options
The File Options in Power BI are:
- Save a copy: Duplicate reports for modifications without affecting the original.
- Download this file: Download the report (.pbix) with a full dataset or connected online datasets.
- Manage permissions: Control report access via direct access settings or shared links.
- Print this page: Print the report.
- Embed Report: Embed report in SharePoint or external sites.
- Generate a QR Code: Create QR codes for quick access to reports.
- Settings: Modify report names, descriptions, access settings, and features.
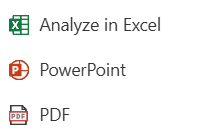
Export Menu Options
Power BI provides multiple export formats for data analysis and presentation:
- Analyse in Excel: Open datasets in Excel with Pivot Table functionality.
- PowerPoint Export: Embed Power BI reports as live or static images.
- PDF Export: Generate custom PDF reports with applied filters.
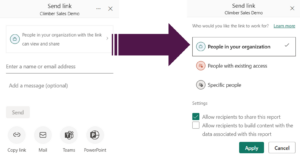
Share Menu Options
The button provides for secure internal sharing:
- Share reports securely with individuals or groups.
- Retain filters when sharing reports to maintain data consistency.
- Sharing reports to external users is possible, but requires inviting the external user(s) to your organisation in the Power BI Admin portal. The internal user must have the guest inviter role in Microsoft Entra ID.
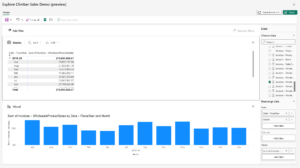
Explore Menu Options
This button opens a dialog box for further data analysis and exploration. Users can save the work and create reports from their exploration.
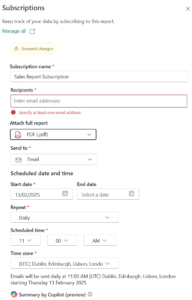
Subscribe Menu Options
When users wish to receive a copy of the report on a scheduled basis, the Subscribe button allows users to set this up for themselves or for colleagues. It is possible to get an AI generated summary as well.
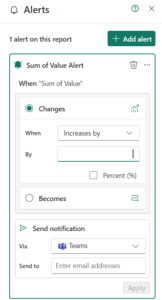
Set Alerts Menu Option
Use alerts in Power to monitor specific metrics in a report and alert responsible people should the value vary outside of the preconfigured range. This can be extremely helpful to prevent “report fatigue” where users ignore reports due to receiving too many.
Metrics can be monitored for actual or percentage increases/decreases. Alerts can be sent by email or Microsoft Teams.
Edit Menu Options
This option is only available to users with the role of either Admin, Member, or Contributor.
Clicking this button opens the report in an online version of the Power BI Desktop App. However, not all the functionality of the desktop app is available online. It is preferable to edit reports using the Power BI Desktop App. This has the additional benefit of keeping the offline and online versions in sync.
Once edited, the user has the option to save the report or use the “Save As” option to create a copy of the report.
Ellipsis Menu Options
On the right side of the menu is an ellipsis with additional options.
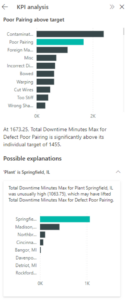
Get Insights Menu Option
This is a preview feature available in workspaces hosted in Premium or Premium per User capacities. This feature uses artificial intelligence to generate insights such as anomalies, trends, and KPIs from the data in the report.
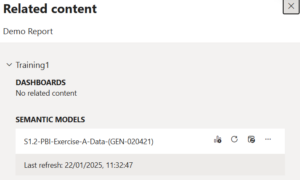
See related content Menu Option
This feature is available in workspaces hosted in Premium or Premium per User capacities. It shows links between the current report and other objects such as reports, dashboards & semantic models. This allows users to determine if other reports share the same semantic model or whether some of the visuals from the current report are used in a dashboard.
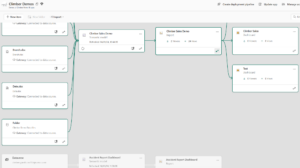
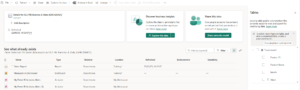
Open workspace lineage Menu Option
This option allows users to see the lineage with regards to any data used to build the report. Lineage view shows the process the data has gone through, and any related objects that share the data.
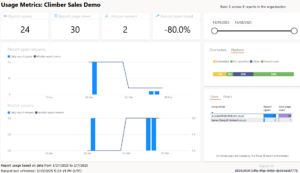
Open usage metrics
This helpful option gives insights into how active the report is in terms of how many times it has been opened, how many unique viewers the report has, trends as far as opening the report is concerned, and other usage related metrics.
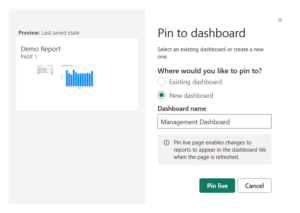
Pin to a dashboard Menu Option
A dashboard is a collection of visuals, typically built from multiple reports. For example, a management dashboard may have KPI gauges from the sales and marketing departments, a graph showing sick leave from human resources, and a table showing mileage per vehicle from the logistics department.
This menu option allows the adding of the entire page of the current report to a dashboard.
View semantic model Menu Option
The semantic model is the underlying data that the current report relies on as its data source. The semantic model includes all the various tables used to build the report, as well as any calculated columns and measures that were built and the relationships between the tables.
This option gives the user a view of the semantic model, showing the other objects that refer to the same semantic model, a list of the tables, and fields and the option to share the model with others. It is even possible to explore the data and build new reports using this option.
Final Thoughts: Maximising Microsoft Power BI for Business Intelligence
Power BI is an indispensable tool for organisations looking to analyse, manage, and share data effectively. By mastering Power BI’s service options, security settings, and collaboration tools, businesses can enhance efficiency, strengthen security, and drive data-driven decision-making.
Strategic use of Power BI reports, AI-powered insights, and interactive dashboards enables users to transform raw data into actionable intelligence.
If you want to know more about how Power BI can help you and your business, why not reach out to us. Climber has a team of experts ready to help you leverage your data to create intelligent business.

WANT TO KNOW MORE? CONTACT US!
Scott Davies
BI Consultant & Training Manager
scott.davies@climberbi.co.uk
+44 203 858 0668
James Sharp
Managing Director
james.sharp@climberbi.co.uk
+44 203 858 0668
News archive

AI meets Data Literacy – How emerging tech is reshaping decision-making
AI is changing decision-making by enhancing data accessibility and insight generation, making data literacy more crucial than ever. This blog highlights the growing need for organisations to combine AI awareness with strong data skills across all roles.
>> Read more
What is Microsoft Power Apps?
Microsoft Power Apps is a low-code platform that enables businesses to swiftly develop custom applications tailored to their unique needs, without requiring extensive coding knowledge. In this blog you will learn more about the components, use cases, and benefits for your business.
>> Read more
People and Data Literacy in the age of AI
Welcome to join our webinar on 7th May to learn how to strengthen data literacy within your organisation and build a culture where data and AI support people’s expertise — instead of replacing it.
>> Register now